There are 2 different methods to list down all the connections present in Postgres database - using SQL query and using PgAdmin. In this guide, we will explore these two methods and discuss the step-by-step process to run them.
Let’s get started
Using SQL query
Step 1 - Open you terminal and connect it to the Postgres database. Check out guide to follow the steps, click here
Step 2 - To get the details of all connections created in each Postgres database, run this sql query
SELECT * FROM pg_stat_activity;pg_stat_activity displays the information about the current activity of
database connections present in PostgreSQL database server. Check out the
official documentation to learn more about
it.

-
dataid - It shows the Object ID of the connected database.
-
datname - It shows the names of the connected database. It gives the human-readable name of the database connected with the session.
-
pid - It shows the process ID (pid) of the backend server process associated with the session. There is a backend process for each individual active session.
-
usesysid - It lists down the system identifier of all the users who has started the session.
-
application_name - It shows the names of the client application that started the session. In many cases, it is defined by the client application while building a connection to the session.
-
backend_start - This column represents the timestamp when the backend process was initiated.
Using PgAdmin
Step 1 - Open the Databases by expanding the Servers in Object Explorer.
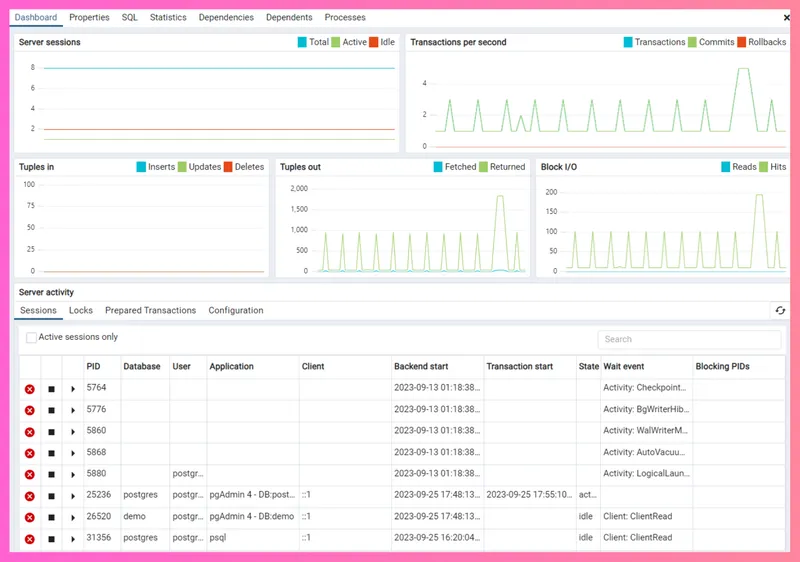
Step 2 - Navigate to the Dashboard section present on the right-hand side.

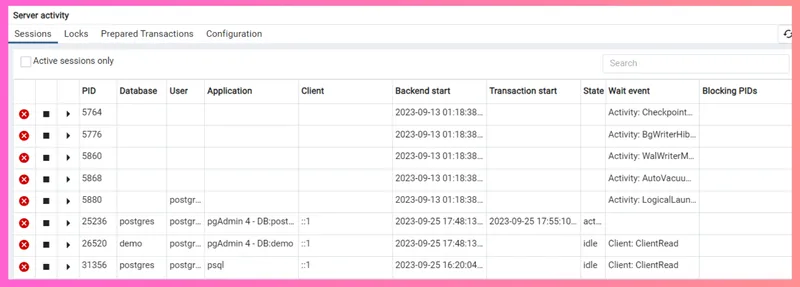
Step 3 - There you will see the Sessions tab present in the Server activity section. It will display the list of all connections created in each database.

Along with Server Activity, it shows some other important statistics as well - Server Sessions, Transitions per Second, Tuples In and Tuples Out, Block IO.
-
Server Sessions - It shows the details about the sessions or connections that are currently going on in the PostgreSQL server.
-
Transactions per Second - It represents the rate or time at which the transactions are being treated by the database server.
-
Tuples In and Tuples Out - Tuples In shows the number of rows added to the database. Tuples Out shows the number of rows fetched from the database.
-
Block IO - It shows the input and output operations performed on the disk blocks.
Conclusion
In this guide, we discussed different methods to list down all the connections present in Postgres
If you are interested to learn more about Postgres, we highly recommend you to check out other guides.
Do check out the Tembo blogs for more launches and interesting news.
